Relax, here are some important things to know about Lightning Web Components (LWC)

On December 13, 2018, Salesforce announced the upcoming release of Lightning Web Components at Salesforce World Tour in New York. In a nutshell, Lightning Web Components is a new programming model that represents a big shift in Salesforce development towards web components and modern JavaScript development.

If you are an existing Salesforce developer, then that last statement may have made you cringe a bit and you may now be thinking:

“Big Shift? Wait…What?”

“Didn’t we just go through a big shift with Lightning Components?”

“Are you saying I have to learn something new again? I am still not even sure how Lightning Components work. Please tell me you are kidding!”

To help ease your discomfort, or even if you are excited about the announcement, I will attempt to answer some questions you may have:

Aura Components aren’t going away and will work very well with LWC’s

And now you might be asking, “Wait, what are Aura Components?”

“Aura Components” are what was previously known as “Lightning Components”. They will now be known as Aura Components because there was a need to distinguish them from the new Lightning Web Components. The name “Aura” is used because these components are based on the Aura framework. Lightning Web Components are named as such because they are based on standard web components.

Basically, there are now two ways to develop Lightning components:

  1. Aura components – what you have known as lightning components
  2. Lightning Web Components – the new way to create lightning components

So if you have invested a lot of time learning about Lightning Components, don’t worry. Those components are not going anywhere and you can continue to create and use them. At the same time, you can start to learn about the new Lightning Web Components and once you are ready you can start building either kind, or both. The really cool thing is that LWC’s are designed to work together with aura components.

Components you build with LWC should render faster

LWC’s will take advantage of native web standards that exist in the browser. This means there is no added abstraction layer, like the Aura framework (or any framework for that matter) to slow things down. It also means LWC’s will most likely render faster than aura components.

That does not mean that aura components are bad and should be avoided. However, in cases where performance is really important to a components success, you should probably consider LWC’s.

Developing LWC’s is fun!

I have been fortunate to be part of the pilot for LWC’s and the overwhelming feedback that has been coming in from all the other people that are part of the pilot is that “Developing LWC’s is fun”. One reason it is fun, is because developers are able to finally use modern JavaScript syntax that has been off limits to aura components. And if you are not sure what I am talking about with modern JavaScript, check out this post.

As an added bonus, because LWC’s utilize common web standards, it should be easier to find developers with the skills to develop LWC’s. It might also be easier to transition existing developers to using LWC’s because there is no additional framework to learn.

You need to check out the new and updated apps in the Sample Gallery

You may not know this, but the Developer Relations team hosts a very cool sample app gallery available here. This app gallery features LWC updated versions of all the sample apps you have grown to love (like Dreamhouse and Northern Trail Outfitters), but it also includes two new sample apps you will love even more:

  1. Recipes – This app is all about bite-sized (30 lines of code or less) LWC recipes. Once installed you will have access to several tabs and each one features multiple LWC’s that highlight a very specific use case. The best part about this app is that you can rest assured that best practices were considered right from the start. Feel free to use this as the starting point for all your new LWC’s.

Recipes.png

  1. E-Bikes – This represents what an actual retailer might build using LWC’s. It shows off all the best of LWC’s in a real-world kind of application.

ebikes.png


You cannot create LWC’s in Dev Console and need to use VS Code and the extensions

Sorry to say, but you cannot create LWC’s in Developer Console. For now (and Safe harbor, note the word “now”), you will need to use Visual Studio Code and the CLI extensions for SalesforceDX. Now, just in case you have not dipped your toes into the world of SalesforceDX, this represents your perfect opportunity to get started. I would suggest you start by checking out this great trail on Trailhead.

Going GA in Spring 19 – At that time it will support LEX, Mobile App and Communities

LWC’s will not be generally available until the release of Spring 19, which should be in February 2019. But, there is no reason to wait until then. You can sign up for a pre-release org now and your first step after that should be to go to Trailhead and earn the Quick Start: Lightning Web Components badge. It only takes 20 minutes and it will get you setup with everything you need to start building your own LWC’s.

Hopefully, you are feeling a little less apprehensive about this shift. It truly is a GREAT time to be a developer and I have no doubt that in time you will come to love creating LWC’s. Have fun!!!

Modern JavaScript Development – What is it and why should I care?

Are you an experienced software developer? Well, unless you have been living under a rock, you have probably heard at least once that you should learn more about JavaScript to remain relevant as a developer. You may have even heard the phrase “Modern JavaScript Development” tossed about like knowing what that means is just common knowledge. But is it? I don’t think so.

JSI am very happy to announce that a new Trailhead module I have been working on called, Modern JavaScript Development was just released. It is part of a new trail called Learn to Work with JavaScript. This trail not only features my module, but one written by the fabulous developer Evangelist, Peter Chittum that was released in September called JavaScript Skills for Salesforce Developers.

My module was written specifically for Trailblazers that only have a basic understanding of the syntax and features of JavaScript ES5. And if you don’t know what I mean by ES5, then it is also for you. Basically, if you have ever copied some JavaScript and maybe not understood everything it does, then this module is for you. Along with the one that Peter wrote.

And here are just some of the things you will learn in this module:

  • Describe the current state of JavaScript development.
  • Describe the difference between function and block scoping.
  • Recognize shorthand ES6+ syntax used to initialize variables.
  • Identify the new destructuring syntax used to separate data.
  • Identify the backtick character used to create template literals.
  • Recognize the fat arrow syntax for functions.
  • Explain why defining optional parameters in ES6+ results in cleaner code.
  • Describe the different uses for the ‘…’ operator.
  • Explain what’s different about how you create and invoke classes in ES6+.
  • Recognize the basic syntax and different importing styles used to define modules.
  • Demonstrate how asynchronous calls can be chained together using promises.
  • Demonstrate how an async function can be used to call a promise.
  • Identify the different elements used in a Jasmine testing script.
  • Create a simple Jasmine test suite and run it stand-alone.

Sound exciting? I hope so. And I hope you find the module useful. There is an awful lot that can be said about Modern JavaScript Development and ES6 specifically, but I tried to boil it down to just the most important things I thought you should be aware of.

And finally, if you want to learn even more about JavaScript and Salesforce, you should also check out Dan Appleman’s FREE Pluralsight course called Getting Started with JavaScript in Salesforce.

Lightning Component Best Practices at Florida Dreamin 2018

Thank you for everyone that attended my talk about Lightning Component Best Practices at Florida Dreamin. As promised, here is a link to the slide deck: Florida Dreamin 2018 – Lightning Tips. Hope it is super helpful to you.

Don’t forget to also check out the other articles on this blog such as:

Debugging Lightning Components with the Salesforce Lightning Inspector

Top 5 Lightning Debugging Tips

Why you should be using the Lightning Data Service whenever possible

5 Ways to Build Lightning Fast Components

FLD18.jpg

Not to be missed Developer Content on Trailhead

THLogoOk, I know I work for Trailhead and so I am a little bit biased, but I just have to say that we released some incredibly awesome developer-based content in September. If you are a serious Salesforce developer that has been waiting for some juicy content from Trailhead, I think you will really like what we have out right now. This post highlights my favorites.

Got Slack?

A lot of teams do and they love it. If your team does, wouldn’t it be cool if you could integrate Slack with systems in your own company? Well you can. Using webhooks, you can bring notifications and data in from other systems and build your very own Slack app. You can even use AI services to create your own intelligent Slack bot.

To get started, check out this beginner module, Slack Development Basics. Once you know the basics, you can move on to working through the Build a Welcome Bot for Slack. In that hands-on project, you will use Node SDK’s and the Slack API’s to build a welcome bot that interacts with users that signup to your channel.

What about Heroku?

If you have not been playing around with Heroku, then you are missing out. Seriously! Heroku is such an incredible platform and EVERY Salesforce developer should be looking at how they can work with it to deliver incredible online experiences.

We have two new projects that you need to check out. If you are new to Heroku, then look at Quick Start: Build a Java App on Heroku, which is a simple three step project that will get your feet wet with creating, deploying and scaling a simple Java app on Heroku.

More experienced developers wanting to see a rich end-to-end solution will want to move straight to Develop a Heroku App that Integrates with Salesforce, which walks you through installing the Dreamhouse App to Heroku and then setting up Heroku Connect so that property data is synced both ways between your Salesforce org and Heroku app. You will even see how to implement continuous delivery through Heroku Pipelines and Flow.

Need to know more about JavaScript?

Every Salesforce developer should be trying to enhance their JavaScript skills since the Lightning platform is all about JavaScript. JavaScript Skills for Salesforce Developers is just what you need to learn the key JavaScript skills that you need to take your Visualforce pages and Lightning Components to the next level.

Think you know enough about Unit Testing?

I bet you could learn some more and I know just the module to help. This new module called Unit Testing on the Lightning Platform dives deep into topics such as positive and negative testing, using a mock and a stub, as well as permission-based testing. It even covers testing JavaScript with the Lightning Testing Service.

Finish it all off with Alexa

Ready for some fun? We have a super fun project that uses a new voice platform called Violet to build an Alexa-based app that links back to your Salesforce org. Quick Start: Violet will walk you through setting up an Alexa Skill that lets you plan a game night for your friends.

Have fun!!!


Does someone mentioning Artificial Intelligence make your pulse race?

It’s ok if it does. Most people – even the ones that “know” a thing or two about artificial intelligence are a bit nervous about it right now. Not only is there a lot of uncertainty, but there is just an over abundance of information out there. And not all of it is accurate.

So, if the subject makes your head spin and you would like to know the answer to these questions:

“What exactly is Artificial Intelligence?”

“Why is it such a big deal now?”

“How will it make my life better?”

“Where can I learn more about it?”

Come check out one of my two Dreamforce sessions titled, “How to Embrace Artificial Intelligence”

Wednesday, September 26th at 5:30 pm

And

Thursday, September 27th at 1:00 pm

Screen Shot 2018-08-29 at 5.57.08 PM.png


Check out the Salesforce API Explorer

In an attempt to make things easier for us developers, the Developer Relations group has created a nice little tool called the Salesforce API Explorer.

Screen Shot 2018-08-23 at 1.48.18 PM

What It Includes Now

The first thing you should know about this tool is that it is still in Developer Preview and the team that created it is actively seeking feedback on how it can be improved. You can submit feedback right from the Send us Feedback link at the top.

As of this writing, there are only the following two API’s featured here:

  • Force.com REST API
  • Marketing Cloud REST API

How You Can Help

Remember when I said this was still in Preview mode? Well, you can easily vote on which API’s will be included next by clicking the like button underneath the API’s listed in the “Which API’s would you like to see here next?” section. Please take the time to go through the list and vote for which ones you would like to see appear next. Come on. You can’t complain about a lack of good documentation without taking the time to be part of a solution.

Why It is So Cool

This Explorer tool is not only cool because of the fact that it will list all the API’s in one place in a nice readable way. But, it is VERY cool when you consider the nice “Try it now” feature that lets you see the results of executing any of the API calls against your developer org.  You just need to provide credentials for your org.

You will then select a Resource, such as Account and then an endpoint, such as FindAccountById. Not only does this show you all the documentation you need for that endpoint, but you can try it out by doing the following:

  1. Click Try it Now
  2. Enter any path parameters (if needed), such as the Account ID
  3. Click Execute
  4. A Live response appears on the right

Screen Shot 2018-08-23 at 6.35.09 PM.png

Boom! You don’t have to go into workbench. You can do everything you need right here in the explorer tool. Cool, right?

Debugging Lightning Components with the Salesforce Lightning Inspector

Since Lightning Components are built with JavaScript, you can use standard browser development tools, such as the Chrome Developer Tools to debug your components. You can easily access the tools by right-clicking in your Chrome browser and clicking Inspect. You can learn more about the Dev Tools and how to debug with them from this great video here.

But, if you are really serious about debugging your Lightning components, then you need to go one step further and install the Salesforce Lightning Inspector, which is available as a Google Chrome extension. Just click the last link and select the Add to Chrome button. Once installed, you will have access to another tab in the regular Dev tools called Lightning.

Inspector

Why this tool? Because it gives you an inside peek into exactly how your Lighting Components are constructed and behaving. The Lightning Tab includes several sub tabs, which each reveal more detailed information about your component, beginning with the Component Tree.

Component Tree Tab

The Component Tree shows you a detailed tree view of the structure of your components. As opposed to the regular elements tab in Dev Tools, which only shows you the rendered version of your components, the Component tree shows you the actual components themselves and gives you information about the attributes they use.

For example, if I use the component tree to look at the Race Tracker Lightning app and expand the elements of the tree, I can click on one of the elements (such as the Race Type, which is really just a lightning:select component) and see detailed info about that component on the right.

ComponentTree.png

Notice how when I select the lightning:select component in the component tree window, that component is highlighted in the browser. Also notice on the right, I have additional information displayed about the attributes and value provider. This type of information can not only be valuable as you are debugging components, but also when learning what all is possible with your existing components. You may discover attributes here you did not even know existed.

Performance Tab

Next up is the Performance tab, which at first glance may look very similar to the regular Performance tab offered by the Dev Tools. However, the Lightning Performance tab provides information that is just specific to your Lightning components and not the Document Object Model (DOM), so you do not have to sort through stuff you are really not interested in.

To use the tab, you must first click the circle icon, which should turn to red when it is turned on. But this is not all you must do. You must also refresh your page or perform  some action and then click the graph icon to show the current Collected data. Only then will you see information such as you see below.

Performance.png

Once the chart is loaded, you can hover over areas in the timeline and narrow in on certain areas, or click on one of the components and see specific performance info about just that component. This can be especially useful when you have a slow performing Lightning page with several components. You can use the chart to visualize the performance of each component and then spot pretty easily any outliers.

Transactions Tab

The Transactions tab is similar to the Performance tab in that you must toggle the recording on before getting any useful information. But the transactions that appear here are triggered by Salesforce apps, so I do not see much use in this particular tab.

Event Log Tab

Just like with the Performance and Transactions tabs, this tab requires you to toggle on the recording and then initiate some action (like a button click) or refresh the page to see the results. You will likely be amazed once you see just how many events are firing off behind the scenes. You can easily spot whether the event was a component or an app event by looking for CMP or APP below the event. And there are buttons that let you filter for either one, as well as unhandled events.

Screen Shot 2018-07-22 at 10.22.45 PM.png

Expanding out the event will reveal very useful information such as the parameters, caller, source, duration and call stack. You can also click the Toggle Grid button to toggle on or off a diagram of the event. This can be very useful when you have a page with multiple components and you are not sure which component fired which event.

Screen Shot 2018-07-22 at 10.38.32 PM.png

Actions Tab

This is my favorite tab and one I use the most. Toggling on the recording will show you actions sorted according to whether they are pending, running, or completed. The view defaults to show all actions, but you can narrow down the list by using the filter buttons at the top. This can be useful for quickly zeroing in on an error since most pages will produce a lot of actions. For example, you can toggle off all the action types, except for error in order to just see those actions.

Screen Shot 2018-07-23 at 7.59.21 AM.png

You can see from the image above, narrowing down my list shows that I have one action that produced an error on the Race Tracker page and it was the one to get all the races. To see the error message that was returned, I can expand the action node. This will also show me the component source, which in this case is the ListRaces component.

Screen Shot 2018-07-23 at 8.05.18 AM.png

Storage Tab

The final storage tab shows you the client-side storage size of any storable actions your page may use. It will also show the specific items contained in storage, if you expand out the items.

Screen Shot 2018-07-23 at 9.27.25 AM.png

If you do not know about storable actions and want to learn more, check out this post. They are easy to use and can really improve the performance of your components.

If you found this article useful, you might want to checkout my latest course on Pluralsight titled, Lightning Component Development Best Practices.

Top 5 Lightning Debugging Tips

top5 This month I had the honor of speaking at Texas Dreamin’ 2018 . My topic was Lightning Performance and Debugging Tips for Developers. The talk was a combination of things I went over at last year’s Dreamforce talk about 5 ways to Build Lightning Fast Components and some new stuff I have learned recently about debugging. You can check out the slides here at Lightning Performance and Debugging Tips for Developers.pptx.

The new debugging tips include the following:

# 1 – Check Debug Mode Setting

Debug mode is what you can toggle to allow detailed debug messages to appear in your browsers console log and these messages can really help you not only to debug your components, but they sometimes feature important messages about performance.

For the debug mode, you want that to be enabled in development, so you can get those messages you need as you are developing. Just remember that in production, you want to make sure this is turned off b/c when it is enabled, it means that all the css and javascript that is downloaded to the client is not minified. This means it will take longer to download and longer for your components to render. That is why you do not want it enabled in production.

DebugMode

# 2 – Use the Salesforce CLI Linting Tool

This tip involves using a feature that is available with the Salesforce DX CLI. And in case you are not familiar with Salesforce DX, it is essentially just a set of tools that allow developers to really streamline the whole Salesforce development process through source driven development. But, the particular tool that I want to focus on now is the CLI or Command Line Interface because it includes a linting tool that lets you scan your lightning code and determine whether it is violating any anti-patterns that could be impacting performance or even just causing problems in your code. It will give you messages that explain what is wrong with the code and so you have a chance to address them.

In case you are not familiar with linting, this is just a process of scanning and analyzing code before it is executed to look for known problems. This is a very good proactive development practice to get into. You can get more info about this tool from this link here.

# 3 Use debugger and Dev Tools

If you want to trouble shoot problems as they are occurring in real time you are going to need to work with the browser developer tools, like what you find in Chrome. This next tip has to do with adding a line of code to your Lightning JavaScript code that will call the debugger statement. Doing this will actually pause the execution of your JavaScript and allow you to step through the code and look at the value of any variables you have. It is like setting a breakpoint in your code and you can see an example of it below where I have added it to the code for the createNewRace function.

debugger1.png

To see this work, you will need to use your browser developer tools. Once you do, and you get to the place in your code where the debugger line is executed, you will see something like the following when it is paused in the debugger.

debugger2

To get more info about using the debugger statement, you can check out this URL which sends you to a video that was done by one of the Chrome tools technical writers where he walks you through using it.

# 4 – Use Lightning Testing Service

The next tip has to do with the tool that you may not have heard of since it is only in Pilot and that is the Lightning Testing Service. This is a set of tools, that is actually available as open source on GitHub and it allows you to create test suites that are used specifically to unit test your JavaScript code, such as what you see here.

LTS1.png

You know how you have to write unit tests for your Apex server-side code, but there is not really anything for testing the client-side? Well, this is it. Test suites can be written in Jasmine or Mocha or you can create your own wrapper if you are using some other test framework. 

You can go to the URL you see here to see a great article that was written on the Salesforce Developers Blog about how to get started with it. And what you see here is just a listing of all the tests that are provided out of the box when you install the testing service.

LTS2.png

It comes with 18 tests which get you started writing your own test suites. It is pretty easy to use and if you are serious about lightning development and want to create very stable apps, then this a must have tool for you.

# 5 – Use the Lightning Inspector Plugin

The last tip is to use the Lightning Inspector Plugin, which is a Google Chrome plug-in that you can install to tell you about what is going on under the covers for your Lightning components. Once you do you will have access to a new Lightning tab in the Chrome Dev Tools, which you may be able to see below. Notice the tab that is surrounded by a red rectangle.

Inspector.png

I plan on doing another post soon where I go over in detail some of the great info you can get from this tool, But for now, I strongly encourage you to go ahead and install it. You can simply bring up the Lightning Experience in Salesforce and access your Developer Tools to check it out.


Why the recordForm component is so AWESOME!!!

The Summer 18 Salesforce release is almost here, and as usual it contains lots of great features. But one new feature, the lightning:recordForm component has not gotten the coverage I think it deserves. So, I wanted you all to know just how cool this new Base Lightning Component really is, by showing you the code for a Quick Contact component

To truly appreciate how far we have come with Lightning development, I would have to show you what the equivalent code without Base Components looked like. But, that would be like bringing you back to the stone ages and who needs that. Instead I will just point you to the code used to build something similar using what was available before the new recordForm component.

And to see that, I will direct you to a great tutorial on GitHub that was designed to show you how to Build Lightning Components with Salesforce DX. And if you have not started using Salesforce DX yet (and I cannot imagine why you have not) then this is the perfect opportunity to get started. In this step-by-step tutorial, you will be led through creating 3 lightning components:

Component # 1 – quickContactView

Uses the lightning:recordViewForm and several lightning:outputField base components to create a read-only version of the Quick Contact Form.
Screen Shot 2018-07-05 at 10.28.48 AM

Component # 2 – quickContactEdit

Uses the lightning:recordEditForm and several lightning:inputField base components to create a editable version of the Quick Contact Form.
Screen Shot 2018-07-05 at 10.30.13 AM

Component # 3 – quickContactViewEdit

Uses aura:if‘s and a lightning:buttonStateful base components to toggle between the quickContactView and quickContactEdit components.
Screen Shot 2018-07-05 at 10.31.32 AM
The result of using these 3 components, is a form that looks like the following:

Screen Shot 2018-05-28 at 10.14.26 AM

In this version of the component, the user must first click the “Click to Edit” button before they are able to edit the contact fields. This all works fine, but wouldn’t it be better if you could achieve this same functionality by creating only one component?

Ok, you don’t really have to answer that…because the answer is obviously, “YES!”.

The Single Component Alternative

Good news. As of the Summer 18 release, you will be able to do exactly that by using the newly available lightning:recordForm base lightning component. Using it is dead simple and involves code such as the following:
Screen Shot 2018-07-05 at 10.40.50 AM

In that code snippet, I only had to use one attribute and one recordForm base lightning component in a single component to reproduce all the functionality that previously required 3 separate components. BAM! That is practically magic.

So hopefully now you get why this new base lightning component is perhaps the coolest one ever.

Hope you get a chance to check it out and please let me know what you think.

If you found this article useful, you might want to checkout my latest course on Pluralsight titled, Lightning Component Development Best Practices, where I talk about base lightning components and a lot more.

Top 6 Tips for Working with Lightning Testing Service

Lightning Testing Service (LTS) is a set of tools designed to help you test the JavaScript in abt
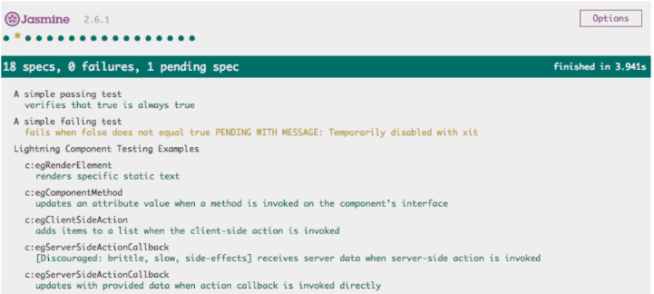
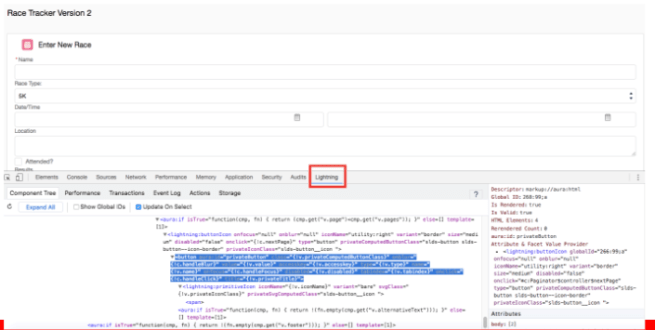
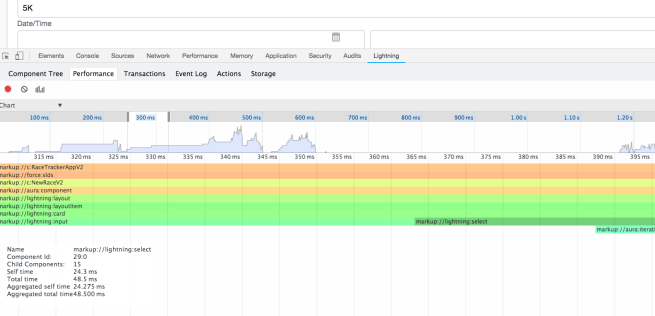
your Lightning Components. Even though it is still in pilot, if you are developing Lightning Components, I highly suggest you take the time to check it out. Using this tool will be very important in ensuring that your components behave as expected.

As far as what LTS contains and how you use it, I suggest you refer to this Getting Started With Lightning Testing Service post by Christophe Coenraets from the Developer Relations Group. He does a great job of getting you started building your first test suite.

In this post, I will just highlight the super important things you need to know about working with LTS:

  1. You do not have to install SalesforceDX to work with LTS, but I really think you are missing the point if you try to. SalesforceDX not only makes it much easier for you to work with LTS, but the thinking behind using SalesforceDX is very similar to why you need JavaScript testing. Testing your Aura methods with unit tests and manually testing your components is not enough to ensure that your lightning components are behaving correctly. It also does nothing to ensure that they will continue to behave correctly as you introduce more code.
  2. Wrappers are ONLY provided for Jasmine and Mocha. If you want to use another testing framework, you will have to build your own wrapper, which will probably take you about a day to do. But, Jasmine is very easy to use and unless you are already using another JavaScript testing framework, I suggest you stick to Jasmine.
  3. You do not install or use LTS in production. Seriously! This is just for development environments and even better it is for scratch orgs that you create using SalesforceDX.
  4. LTS includes sample code to get you started. This includes not only the Jasmine and Mocha wrappers, but a Lightning App called JasmineTests.app that you can use to jump start your testing. Just follow the instructions in Christophe’s blog post and you should be up an running in no time.
  5. You do have to create and upload Static Resources that contain the JavaScript code for your Jasmine test suites. But, SalesforceDX provides commands for doing this easily so it is not quite such a cumbersome process to replace code as you are doing your development.
  6. This is the most important tip: Do not use LTS to test your server code. Keep your client and server-side testing separate. When calling Apex server methods that insert records with LTS, the data that is created is NOT rolled back. You have to be responsible for rolling back the data yourself. You can still mock the server call and an example of this is provided in Christophe’s blog post as Scenario #6. This is the recommended and best way for you to test the server code in your lightning Components. You can still create (and you actually still need to) regular unit tests to test that your Aura methods work as expected.

Ok, that’s it.

Hope it helps and good luck in your journey towards becoming an AWESOME Lightning Developer using Lightning Testing Service.