Debugging Lightning Components with the Salesforce Lightning Inspector

Since Lightning Components are built with JavaScript, you can use standard browser development tools, such as the Chrome Developer Tools to debug your components. You can easily access the tools by right-clicking in your Chrome browser and clicking Inspect. You can learn more about the Dev Tools and how to debug with them from this great video here.

But, if you are really serious about debugging your Lightning components, then you need to go one step further and install the Salesforce Lightning Inspector, which is available as a Google Chrome extension. Just click the last link and select the Add to Chrome button. Once installed, you will have access to another tab in the regular Dev tools called Lightning.

Inspector

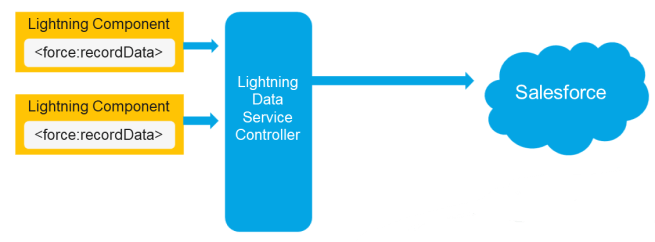
Why this tool? Because it gives you an inside peek into exactly how your Lighting Components are constructed and behaving. The Lightning Tab includes several sub tabs, which each reveal more detailed information about your component, beginning with the Component Tree.

Component Tree Tab

The Component Tree shows you a detailed tree view of the structure of your components. As opposed to the regular elements tab in Dev Tools, which only shows you the rendered version of your components, the Component tree shows you the actual components themselves and gives you information about the attributes they use.

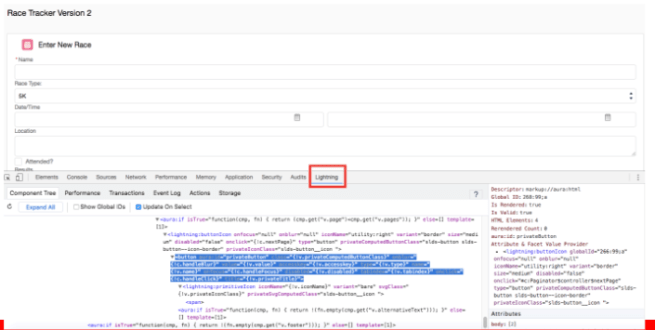
For example, if I use the component tree to look at the Race Tracker Lightning app and expand the elements of the tree, I can click on one of the elements (such as the Race Type, which is really just a lightning:select component) and see detailed info about that component on the right.

ComponentTree.png

Notice how when I select the lightning:select component in the component tree window, that component is highlighted in the browser. Also notice on the right, I have additional information displayed about the attributes and value provider. This type of information can not only be valuable as you are debugging components, but also when learning what all is possible with your existing components. You may discover attributes here you did not even know existed.

Performance Tab

Next up is the Performance tab, which at first glance may look very similar to the regular Performance tab offered by the Dev Tools. However, the Lightning Performance tab provides information that is just specific to your Lightning components and not the Document Object Model (DOM), so you do not have to sort through stuff you are really not interested in.

To use the tab, you must first click the circle icon, which should turn to red when it is turned on. But this is not all you must do. You must also refresh your page or perform  some action and then click the graph icon to show the current Collected data. Only then will you see information such as you see below.

Performance.png

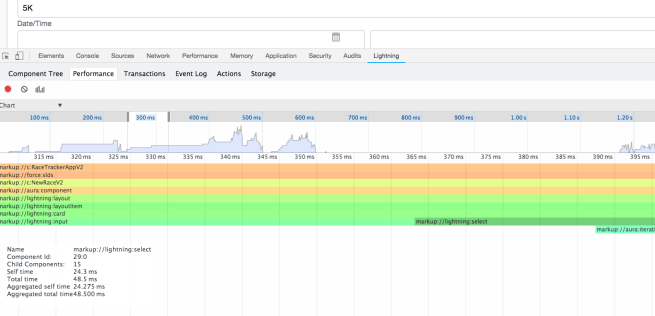
Once the chart is loaded, you can hover over areas in the timeline and narrow in on certain areas, or click on one of the components and see specific performance info about just that component. This can be especially useful when you have a slow performing Lightning page with several components. You can use the chart to visualize the performance of each component and then spot pretty easily any outliers.

Transactions Tab

The Transactions tab is similar to the Performance tab in that you must toggle the recording on before getting any useful information. But the transactions that appear here are triggered by Salesforce apps, so I do not see much use in this particular tab.

Event Log Tab

Just like with the Performance and Transactions tabs, this tab requires you to toggle on the recording and then initiate some action (like a button click) or refresh the page to see the results. You will likely be amazed once you see just how many events are firing off behind the scenes. You can easily spot whether the event was a component or an app event by looking for CMP or APP below the event. And there are buttons that let you filter for either one, as well as unhandled events.

Screen Shot 2018-07-22 at 10.22.45 PM.png

Expanding out the event will reveal very useful information such as the parameters, caller, source, duration and call stack. You can also click the Toggle Grid button to toggle on or off a diagram of the event. This can be very useful when you have a page with multiple components and you are not sure which component fired which event.

Screen Shot 2018-07-22 at 10.38.32 PM.png

Actions Tab

This is my favorite tab and one I use the most. Toggling on the recording will show you actions sorted according to whether they are pending, running, or completed. The view defaults to show all actions, but you can narrow down the list by using the filter buttons at the top. This can be useful for quickly zeroing in on an error since most pages will produce a lot of actions. For example, you can toggle off all the action types, except for error in order to just see those actions.

Screen Shot 2018-07-23 at 7.59.21 AM.png

You can see from the image above, narrowing down my list shows that I have one action that produced an error on the Race Tracker page and it was the one to get all the races. To see the error message that was returned, I can expand the action node. This will also show me the component source, which in this case is the ListRaces component.

Screen Shot 2018-07-23 at 8.05.18 AM.png

Storage Tab

The final storage tab shows you the client-side storage size of any storable actions your page may use. It will also show the specific items contained in storage, if you expand out the items.

Screen Shot 2018-07-23 at 9.27.25 AM.png

If you do not know about storable actions and want to learn more, check out this post. They are easy to use and can really improve the performance of your components.

If you found this article useful, you might want to checkout my latest course on Pluralsight titled, Lightning Component Development Best Practices.

Top 5 Lightning Debugging Tips

top5 This month I had the honor of speaking at Texas Dreamin’ 2018 . My topic was Lightning Performance and Debugging Tips for Developers. The talk was a combination of things I went over at last year’s Dreamforce talk about 5 ways to Build Lightning Fast Components and some new stuff I have learned recently about debugging. You can check out the slides here at Lightning Performance and Debugging Tips for Developers.pptx.

The new debugging tips include the following:

# 1 – Check Debug Mode Setting

Debug mode is what you can toggle to allow detailed debug messages to appear in your browsers console log and these messages can really help you not only to debug your components, but they sometimes feature important messages about performance.

For the debug mode, you want that to be enabled in development, so you can get those messages you need as you are developing. Just remember that in production, you want to make sure this is turned off b/c when it is enabled, it means that all the css and javascript that is downloaded to the client is not minified. This means it will take longer to download and longer for your components to render. That is why you do not want it enabled in production.

DebugMode

# 2 – Use the Salesforce CLI Linting Tool

This tip involves using a feature that is available with the Salesforce DX CLI. And in case you are not familiar with Salesforce DX, it is essentially just a set of tools that allow developers to really streamline the whole Salesforce development process through source driven development. But, the particular tool that I want to focus on now is the CLI or Command Line Interface because it includes a linting tool that lets you scan your lightning code and determine whether it is violating any anti-patterns that could be impacting performance or even just causing problems in your code. It will give you messages that explain what is wrong with the code and so you have a chance to address them.

In case you are not familiar with linting, this is just a process of scanning and analyzing code before it is executed to look for known problems. This is a very good proactive development practice to get into. You can get more info about this tool from this link here.

# 3 Use debugger and Dev Tools

If you want to trouble shoot problems as they are occurring in real time you are going to need to work with the browser developer tools, like what you find in Chrome. This next tip has to do with adding a line of code to your Lightning JavaScript code that will call the debugger statement. Doing this will actually pause the execution of your JavaScript and allow you to step through the code and look at the value of any variables you have. It is like setting a breakpoint in your code and you can see an example of it below where I have added it to the code for the createNewRace function.

debugger1.png

To see this work, you will need to use your browser developer tools. Once you do, and you get to the place in your code where the debugger line is executed, you will see something like the following when it is paused in the debugger.

debugger2

To get more info about using the debugger statement, you can check out this URL which sends you to a video that was done by one of the Chrome tools technical writers where he walks you through using it.

# 4 – Use Lightning Testing Service

The next tip has to do with the tool that you may not have heard of since it is only in Pilot and that is the Lightning Testing Service. This is a set of tools, that is actually available as open source on GitHub and it allows you to create test suites that are used specifically to unit test your JavaScript code, such as what you see here.

LTS1.png

You know how you have to write unit tests for your Apex server-side code, but there is not really anything for testing the client-side? Well, this is it. Test suites can be written in Jasmine or Mocha or you can create your own wrapper if you are using some other test framework. 

You can go to the URL you see here to see a great article that was written on the Salesforce Developers Blog about how to get started with it. And what you see here is just a listing of all the tests that are provided out of the box when you install the testing service.

LTS2.png

It comes with 18 tests which get you started writing your own test suites. It is pretty easy to use and if you are serious about lightning development and want to create very stable apps, then this a must have tool for you.

# 5 – Use the Lightning Inspector Plugin

The last tip is to use the Lightning Inspector Plugin, which is a Google Chrome plug-in that you can install to tell you about what is going on under the covers for your Lightning components. Once you do you will have access to a new Lightning tab in the Chrome Dev Tools, which you may be able to see below. Notice the tab that is surrounded by a red rectangle.

Inspector.png

I plan on doing another post soon where I go over in detail some of the great info you can get from this tool, But for now, I strongly encourage you to go ahead and install it. You can simply bring up the Lightning Experience in Salesforce and access your Developer Tools to check it out.


Why you should be using the Lightning Data Service whenever possible

If you are creating Lightning components and working with a single record of data, you should be using the Lightning Data Service (LDS) or the force:recordData tag.

And for those of you that have not heard about the LDS, you can think of it as the standard controller for lightning components. It is similar to the standard controller used in Visualforce in that it gets you access to your orgs data, but without the need to write any Apex or SOQL and that is a pretty cool thing because when you don’t have to worry about writing Apex, you also do not have to worry about FLS or Field Level Security and CRUD or Create Access Update and Delete security, which is something you would have to specifically check for in your code if you did not use the Lightning Data Service.

You see I have to tell you that all of you Visualforce developers have been a bit spoiled when it comes to security, b/c in most cases, the pages that you wrote did not have to specifically check for these permissions (even when they used controllers). But, the Lightning Platform works very differently than Visualforce and any Apex code you write does have to do these checks, which involves writing more code.

With the Lightning Data Service, you also get other built-in features like auto-notifications when there are record changes, as well as offline access for Salesforce1.

And if all that was not enough to convince you that Lightning Data Service is something you want to use, here is one more really big reason. Even if you have multiple components using the Lightning Data Service, they are all going to use a single request and deal with a cached response and in terms of performance this is huge.

Even if you have multiple components using the Lightning Data Service, they are all going to use a single request and deal with a cached response

So let’s talk about that a bit more. Let’s say you have two components that are using the force:recordData tag. Each one will make a request for data through the Lightning Data Service Controller, and those requests will be funneled into one single request which is sent to the Salesforce server, such as you see here.

LDSDemo2

But what is returned is a response that will be stored in a shared data cache and also returned back to the two components that started all this, such as in the diagram below. And this means that not only will those two components be able to retrieve the data faster than two components that were using their own apex controllers

LDSDemo3

But if a third component that needed that same data were to come along, it would be able to get a cached response almost immediately without even having to make a call to the server. Boom!

LDSDemo4

And the beauty of it all is that you can implement this with just a few lines of markup code in the component and then a few more lines in the JavaScript controller to load and save the record. You do not have to write any Apex or SOQL code to implement this, but you get all the performance benefits.

So now do you see why you need to be using the Lightning Data Service whenever possible?

If you found this article useful, you might want to checkout my latest course on Pluralsight titled, Lightning Component Development Best Practices, where I talk about the Lightning Data Service and a lot more.


Lightning Best Practice: Storable Actions

File_Server_Cache_Blue

Storable Actions are a GREAT way to enhance the performance of your Lightning components and implementing them is incredibly easy, but there is one big gotcha to seeing them work with a stand-alone Lightning Application.

Even though storable actions are automatically configured in Lightning Experience and Salesforce1, any Stand-alone Lightning apps that are used to host your components will NOT use caching by default.

For these apps to use storable actions, you must do these two things:

1.) Add a new component which you can name whatever you want, but I named mine AppTemplateComponent and have it use the following code:

AppTemplateMarkup

2.) You then need to add the following attribute to the aura:application tag of your Lightning Standalone app:

template="c:AppTemplateComponent"

Once you do this, you should be able to see the caching working for any component used in that app that calls the following line of code:

action.setStorable();

Isn’t that amazing?

Just one line of code is all you need to add to start taking advantage of caching in your server-side actions. The impact on performance can be amazing and perhaps the best place to see is when it comes to rendering a list of data (especially if that data is non-mutable and therefore will not be updated).

This best practice really is a no brainer that everyone building Lightning Components should consider using.

If you found this article useful, you might want to checkout my latest course on Pluralsight titled, Lightning Component Development Best Practices, where I talk about storable actions and a lot more.

Lightning Data Service Goes Beta in Summer 17

For the past two Salesforce release cycles the Lightning Data Service (LDS) has been in developer preview, but starting in Summer 17, it moves to Beta. The biggest thing to be aware of is that if you have created any code using the LDS, the markup will need to be changed. Prior to Summer 17, the LDS used the force:recordPreview tag, but this has been replaced with force:recordData.

If you have created code using the Lightning Data Service when it was in preview and named force:recordPreview, you will have to change your markup before that code will work in a Summer 17 org.

So what is the LDS?  (you may be asking yourself)

The LDS is on it’s way to becoming the standard controller (used in Visualforce) equivalent for a Lightning Component. It makes working with data in a Lightning component super easy (as in all you need to do to use it is add a single line of markup code). No Apex code is needed.

Another thing that makes the LDS so cool is that all Lightning components that utilize the recordData tag will have access to a shared data cache. This ensures that they return data as quickly as possible.

LDS.png

If you have not yet checked out the Lightning Data Service (LDS), this is definitely the time to do so. And if you are interested in seeing an example of how a Lightning Component can be greatly simplified using the LDS, go over to Pluralsight and check out my latest course titled,  Customizing Salesforce with Lightning Components. I have an entire module dedicated to Working with Lightning Data Service.

Top 5 Lightning Tips for Visualforce Devs

#1- Transition does not have to be all or nothing

For Visualforce Developers, when it comes to transitioning to Lightning development, it does not have to be an all or nothing deal. Very few development shops/companies will go from doing all Visualforce development to doing all Lightning development overnight. That is just not realistic, nor a good idea, in my opinion.

The introduction of Lightning Out offered a lot of options for Visualforce developers wanting to slowly transition to Lightning. If you want to learn what options are available in terms of a transition plan, I suggest checking out this post and blog series by Salesforce Architect, Mike Topalovich. Mike does an excellent job, not only of giving a lot of background, but of detailing 5 specific migration paths that you will want to consider.

#2 – Watch your Casing

JavaScript is Case sensitive!!!

This is so important, I am going to write it again, “JAVASCRIPT IS CASE SENSITIVE”.

If only I had a nickle for every time I ended up discovering that the odd error I was getting in Lightning was actually caused by a casing error of mine. Seriously, I cannot tell you how many times this has tripped me up. More times than I would probably like to admit.

So anytime you are working with Lightning and you get an error that makes no sense, the first thing you should do is return to your JavaScript code and make sure you did not make a casing error. It really is VERY easy to do. Embarrassingly so.

#3- Security Works Differently

As Visualforce developers, you have been spoiled as far as security is concerned. Visualforce apps operate out of the Force.com domain, which is not shared with Salesforce code. But, Lightning apps and components run in a special domain that is shared with Salesforce-authored Lightning code.

This means that the security for Lightning components are subject to a Content Security Policy (CSP). The rules surrounding what is and what is not allowed with these components will just tighten as time goes on. Go here to learn more about all the concerns regarding Lightning Security.

One important thing that you need to know is that any of your AuraEnabled Apex classes must do an explicit check for CRUD and FLS permissions. This was handled automatically for you in Visualforce pages, but in Lightning, unless you are using the new Lightning Data Service, you will need to do this check manually. You can do so using the isAccessible(), isCreateable(), isDeleteable(), and isUpdateable() methods. You can learn more about how this is done here.

#4 – Install and Use the Lightning Inspector

For Chrome users, there is an excellent plug-in called Lightning Inspector that every Lightning developer should check out. One of the most useful features it offers is a component tree tab, which shows you how the Lightning Framework sees your component. You can use this as a tool not only for debugging components, but learning more about what some of the built-in ones are capable of.

#5 – Check out newest components/features added

The Lightning Framework has been out for a while now (over 2 years actually) and in that time there have been many new releases and lots of new features added. Building Lightning components today is not the same as it was when you may have run through a tutorial or article a year or two ago. If it has been a while since you took a look at what features and components are available, it is time to take another look.

In the last release (Winter 17) many new features were added such as the Lightning Data Service, which you can kind of think of as the equivalent of a Standard Controller for a Visualforce page. Currently this feature is still in developer preview, but using it allows you to eliminate the need for Apex code and also those manual security checks that I mentioned earlier.

I strongly believe that component-based development, such as what you do with the Lightning Framework is the future of web and device-based development. If you have not already dipped your toes in Lightning Development, it is not too late. Things are just getting really good for this modern development platform.