 This month I had the honor of speaking at Texas Dreamin’ 2018 . My topic was Lightning Performance and Debugging Tips for Developers. The talk was a combination of things I went over at last year’s Dreamforce talk about 5 ways to Build Lightning Fast Components and some new stuff I have learned recently about debugging. You can check out the slides here at Lightning Performance and Debugging Tips for Developers.pptx.
The new debugging tips include the following:
# 1 – Check Debug Mode Setting
Debug mode is what you can toggle to allow detailed debug messages to appear in your browsers console log and these messages can really help you not only to debug your components, but they sometimes feature important messages about performance.
For the debug mode, you want that to be enabled in development, so you can get those messages you need as you are developing. Just remember that in production, you want to make sure this is turned off b/c when it is enabled, it means that all the css and javascript that is downloaded to the client is not minified. This means it will take longer to download and longer for your components to render. That is why you do not want it enabled in production.

# 2 – Use the Salesforce CLI Linting Tool
This tip involves using a feature that is available with the Salesforce DX CLI. And in case you are not familiar with Salesforce DX, it is essentially just a set of tools that allow developers to really streamline the whole Salesforce development process through source driven development. But, the particular tool that I want to focus on now is the CLI or Command Line Interface because it includes a linting tool that lets you scan your lightning code and determine whether it is violating any anti-patterns that could be impacting performance or even just causing problems in your code. It will give you messages that explain what is wrong with the code and so you have a chance to address them.
In case you are not familiar with linting, this is just a process of scanning and analyzing code before it is executed to look for known problems. This is a very good proactive development practice to get into. You can get more info about this tool from this link here.
# 3 Use debugger and Dev Tools
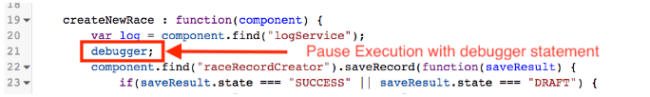
If you want to trouble shoot problems as they are occurring in real time you are going to need to work with the browser developer tools, like what you find in Chrome. This next tip has to do with adding a line of code to your Lightning JavaScript code that will call the debugger statement. Doing this will actually pause the execution of your JavaScript and allow you to step through the code and look at the value of any variables you have. It is like setting a breakpoint in your code and you can see an example of it below where I have added it to the code for the createNewRace function.
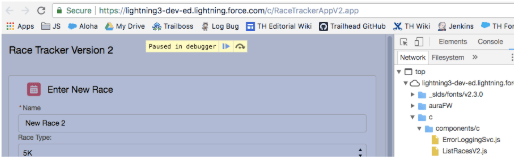
To see this work, you will need to use your browser developer tools. Once you do, and you get to the place in your code where the debugger line is executed, you will see something like the following when it is paused in the debugger.
To get more info about using the debugger statement, you can check out this URL which sends you to a video that was done by one of the Chrome tools technical writers where he walks you through using it.
# 4 – Use Lightning Testing Service
The next tip has to do with the tool that you may not have heard of since it is only in Pilot and that is the Lightning Testing Service. This is a set of tools, that is actually available as open source on GitHub and it allows you to create test suites that are used specifically to unit test your JavaScript code, such as what you see here.
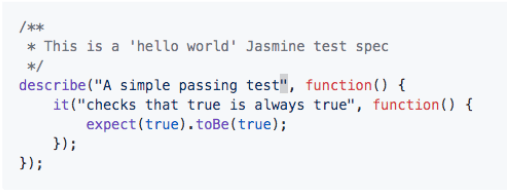
You know how you have to write unit tests for your Apex server-side code, but there is not really anything for testing the client-side? Well, this is it. Test suites can be written in Jasmine or Mocha or you can create your own wrapper if you are using some other test framework.
You can go to the URL you see here to see a great article that was written on the Salesforce Developers Blog about how to get started with it. And what you see here is just a listing of all the tests that are provided out of the box when you install the testing service.
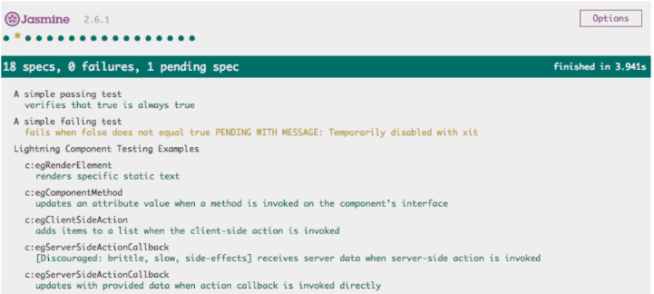
It comes with 18 tests which get you started writing your own test suites. It is pretty easy to use and if you are serious about lightning development and want to create very stable apps, then this a must have tool for you.
# 5 – Use the Lightning Inspector Plugin
The last tip is to use the Lightning Inspector Plugin, which is a Google Chrome plug-in that you can install to tell you about what is going on under the covers for your Lightning components. Once you do you will have access to a new Lightning tab in the Chrome Dev Tools, which you may be able to see below. Notice the tab that is surrounded by a red rectangle.
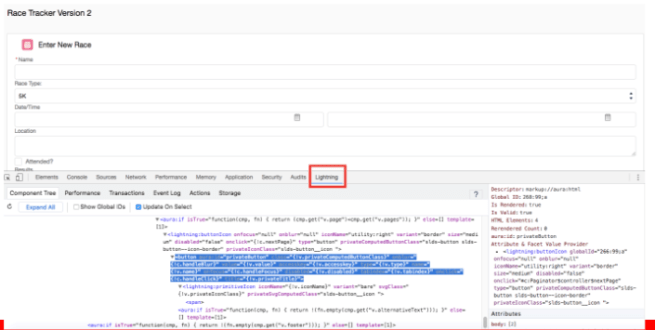
I plan on doing another post soon where I go over in detail some of the great info you can get from this tool, But for now, I strongly encourage you to go ahead and install it. You can simply bring up the Lightning Experience in Salesforce and access your Developer Tools to check it out.
 your Lightning Components. Even though it is still in pilot, if you are developing Lightning Components, I highly suggest you take the time to check it out. Using this tool will be very important in ensuring that your components behave as expected.
