I recently had the opportunity to redesign a very small web application that was used to display residential housing statistics. The previous application was created over 10 years ago and as you can imagine, now leaves a lot to be desired. It was an ASP.NET application that used many post back operations to render charts using a very limited 3rd party charting tool. It performed slowly and lacked a lot of the key functionality the client wished for (namely the ability to display data for multiple subdivisions within the same chart).
My mission was to create a new ASP.NET solution that performed well on all devices (as this is critical for a web applications success), and was easy to use, yet delivered as much information as possible on a single page. After much consideration, I decided to use the Google Charting API to render the charts. Google Chart tools are simple, free and interactive.
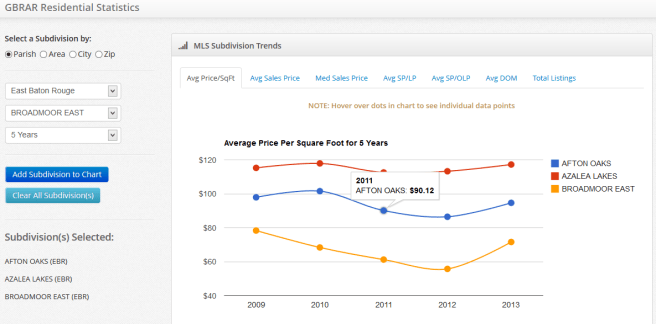
I also utilized Bootstrap to create a modern and responsive design and JQuery to enable a fast and asynchronous user interface. Since this post is titled, “Google Charts and ASP.NET”, I will only focus on the code used to render the actual charts. The solution (as seen below) is what I ended up with.
As this is a technical blog, I will now share with you some of the code used to create this solution. The amount of HTML markup used in the ASP.NET page is actually quite small. The code that is used to render the Google Charts is created dynamically in server-side code and is written back to the web page inside of individual div blocks for each data metric.
To use the application, the user selects a subdivision using any one of the four criterias provided (Parish, Area, City, or Zip). If the user selects a certain value (for example, “East Baton Rouge” as the Parish), then JQuery and an Ajax call is used to populate the subdivision select box with only the subdivisions for that parish. The user can add as many subdivisions as they want and once all the charts are rendered (which takes only a few seconds), they can flip between each data metric by selecting one of the tabs across the top.
When a user clicks the “Add a Subdivision” button, a server-side call is made to a method which collects all the search criteria and then passes this off to a function called renderChart in a class called Chart. The code (which is seen below) will call the renderChart once for each data metric displayed and will return a string that contains the JavaScript code needed to render that particular Google Chart.
var sc = new SearchCriteria();
sc.parish = ddlParish.Value.Trim() == "" ? null : ddlParish.Value;
sc.area = ddlArea.SelectedValue.Trim() == "" ? null : ddlArea.SelectedValue;
sc.city = ddlCity.SelectedValue.Trim() == "" ? null : ddlCity.SelectedValue;
sc.zip = ddlZip.SelectedValue.Trim() == "" ? null : ddlZip.SelectedValue;
sc.sub = Request.Form[ddlSubdivision.UniqueID];
sc.timeFrame = ddlTimeframe.Value;
if (this.optParish.Checked) sc.type = "parish";
if (this.optArea.Checked) sc.type = "area";
if (this.optCity.Checked) sc.type = "city";
if (this.optZip.Checked) sc.type = "zip";

var chart = new Chart();
ltAvgPriceSqFt.Text = chart.renderChart("AvgPriceSqFt", sc);
if (chart.blnDataFound)
{
     ltAvgSalesPrice.Text = chart.renderChart("AvgSalesPrice", sc);
     ltMedSalesPrice.Text = chart.renderChart("MedSalesPrice", sc);
     ltAvgSPLP.Text = chart.renderChart("AvgSPLP", sc);
     ltAvgSPOLP.Text = chart.renderChart("AvgSPOLP", sc);
     ltAvgDOM.Text = chart.renderChart("AvgDOM", sc);
     ltTotalListings.Text = chart.renderChart("TotalListings", sc);
}
|
Each time a subdivision is added to a chart, it is also added to a Subdivision List stored in the HTTP Cache. Since it is possible for the user to click Add Subdivision more than once, without changing what subdivision is selected, we want to prevent the same subdivision from being added to the cache multiple times. The following code is the first thing executed in the renderChart function:
List lst = new List();
Cache cache = HttpContext.Current.Cache;
if (cache["selectedSubs"] != null)
{
    lst = (List)cache["selectedSubs"];
    if (lst.Count > 0)
    {
        //Make sure the selected subdivision is not the same as one
        //of the ones already cached
        int idx = -1;
        idx = lst.FindIndex(x => x.SubdivisionName == sc.sub && x.Parish == sc.parish
                    && x.City == sc.city && x.Zip == sc.zip);
        if (idx > -1) lst.RemoveAt(idx);
        if (lst.Count > 0) blnMultipleSubs = true;
    }
}
|
The next thing to do is to get the data used to render the charts. The renderChart function makes a call out to one of two other functions (either GetSqlDataForMultipleSubs or GetSqlDataForSingleSub) within the Chart class to do this. The code below, which returns a DataTable shows this:
if (blnMultipleSubs)
{
    dt = GetSqlDataForMultipleSubs(numberToReturn, sc, lst);
}
else
{
    dt = GetSqlDataForSingleSub(numberToReturn, sc);
}
|
The last thing to do is to loop through the data in the DataTable variable named dt and build a string that will be returned by the function. The code below will accomplish this:
if (dt.Rows.Count > 0)
{
    blnDataFound = true;
    str.Append(@"
    google.load(*visualization*, *1*, { packages: [*corechart*] });
    google.setOnLoadCallback(drawChart);

    function drawChart() {
        var data = new google.visualization.DataTable();
        data.addColumn('string', 'Date');");

    if (blnMultipleSubs)
    {
        foreach (Subdivision sub in lst)
        {
            str.Append(" data.addColumn('number', '" + sub.SubdivisionName + "');");
        }
    }

    str.Append(" data.addColumn('number', '" + sc.sub + "');");
    str.Append(" data.addRows([ ");

    for (int i = 0; i <= dt.Rows.Count - 1; i++)
    {
        str.Append("['" + dt.Rows[i]["date"].ToString() + "', ");
        if (blnMultipleSubs)
        {
            foreach (Subdivision sub in lst)
            {
                str.Append(dt.Rows[i][sub.SubdivisionName].ToString()
               == "" ? "null," : dt.Rows[i][sub.SubdivisionName].ToString() + ",");
            }
            str.Append(dt.Rows[i][sc.sub].ToString() == "" ? "null]" : dt.Rows[i][sc.sub].ToString() + "]");
        }
        else
        {
            str.Append(dt.Rows[i]["number"].ToString() + "]");
        }

        if (i + 1 < dt.Rows.Count)
        {
            str.Append(", ");
        }
        else
        {
            str.Append("]);");
        }
    }

    str.Append(@"
            var options = {width: 850, height: 400,
           pointSize: 10, chartArea: {left: 80}, curveType: *function*, ");

    if (numberToReturn == "AvgPriceSqFt")
    {
        str.Append(@"vAxis: { format: '$#,###' },
        title: *Average Price Per Square Foot for " + sc.timeFrame + "*}; ");
    }
    else if (numberToReturn == "AvgSalesPrice")
    {
        str.Append(@"vAxis: { format: '$#,###'},
        title: *Average Sales Price for " + sc.timeFrame + "*}; ");
    }
    else if (numberToReturn == "MedSalesPrice")
    {
        str.Append(@"vAxis: { format: '$#,###' },
        title: *Median Sales Price for " + sc.timeFrame + "*}; ");
    }
    else if (numberToReturn == "AvgSPLP")
    {
        str.Append(@"vAxis: { format: '#%' },
        title: *Average Sales Price/Listing Price for " + sc.timeFrame + "*}; ");
    }
    else if (numberToReturn == "AvgSPOLP")
    {
        str.Append(@"vAxis: { format: '#%' },
        title: *Average Sales Price/Original Listing Price for " + sc.timeFrame + "*}; ");
    }
    else if (numberToReturn == "AvgDOM")
    {
        str.Append(" title: *Average Days On Market for " + sc.timeFrame + "*}; ");
    }
    else if (numberToReturn == "TotalListings")
    {
        str.Append(" title: *Total Listings for " + sc.timeFrame + "*}; ");
    }

    str.Append(@"
        var chart = new google.visualization.LineChart(
             document.getElementById('" + numberToReturn + @"'));");

    if (numberToReturn == "AvgPriceSqFt" || numberToReturn == "AvgSalesPrice"
        || numberToReturn == "MedSalesPrice")
    {
        str.Append(@"
            var formatter = new google.visualization.NumberFormat(
                {prefix: *$*, negativeColor: *red*, negativeParens: true});
            formatter.format(data, 1);");
    }

    str.Append(@"
        chart.draw(data, options); }");

    str.Append(@"
    NOTE: Hover over dots in
       chart to see individual data points
    ");

    return str.ToString().Replace('*', '"');

}
else
{
    blnDataFound = false;
    str.Append(@"
                hidestuff('startInfo');


                ATTENTION:

                No data was found for the " + sc.sub + " subdivision.
                Please select another subdivision or a different timeframe. ");
    return str.ToString().Replace('*', '"');
}
|
The end result for a call to renderChart will be a string of JavaScript code that will be written back to the HTML page inside of one of the predefined Literal placeholders. For example, a call to renderChart in which there are no other subdivisions in the cache and the search criteria was Parish = “EBR”, Subdivision was “Broadmoor East” and time frame was “5 years”, would produce the following output for just one of the data metrics (in this case the AvgPriceSqFt):
google.load("visualization", "1", { packages: ["corechart"] });

google.setOnLoadCallback(drawChart);
function drawChart() {

var data = new google.visualization.DataTable();

data.addColumn('string', 'Date'); data.addColumn('number', 'BROADMOOR EAST'); data.addRows([ ['2009', 78.36], ['2010', 68.38], ['2011', 61.25], ['2012', 55.76], ['2013', 71.61]]);

var options = {width: 850, height: 400, pointSize: 10, chartArea: {left: 80}, curveType: "function", vAxis: { format: '$#,###' },

title: "Average Price Per Square Foot for 5 Years"};

var chart = new google.visualization.LineChart(document.getElementById('AvgPriceSqFt'));

var formatter = new google.visualization.NumberFormat(

{prefix: "$", negativeColor: "red", negativeParens: true});

formatter.format(data, 1);

chart.draw(data, options); }
I really enjoyed working with Google Charts and found it to be very lightweight and flexible. I did not find it necessary to use the Google .NET Wrapper to work with it and ASP.NET. In fact, I will do a separate post about this since it will take a while to go into why this is the case and this post is already too long.
Hope this helps someone. I will try to save all the code to files and post links to them in the post later.