Goodbye Force.com IDE Beta…Hello Visual Studio Code

Back in 2016, I wrote a post here about how the Force.com IDE was making an epic comeback, with support for Lightning.  At the time I was very excited to see that Salesforce was refocusing it’s efforts towards improving that tool in the form of a Beta. Even though the Force.com IDE was the original tool that Salesforce offered and it had a long history with the development community, it had failed to keep up with the bevy of tools now being offered by third-parties.

Fast forward to today and the recent announcement by Salesforce that the Force.com IDE Beta has been officially discontinued.

So where does that leave Salesforce developers?

Well, not as bad as you might think. Salesforce is not giving up on supporting a local IDE. Nor are they giving up on the original version of the Force.com IDE (at least not just yet). So far, only the new Beta will be discontinued.

It is just that they are focusing their efforts towards improvement of the Salesforce Extensions for Visual Studio (VS) Code. It just made no sense to support two tools and after analyzing feedback from the Beta of the Force.com IDE, the team had to make a clear choice and Salesforce Extensions for VS Code came up the winner.

I personally prefer Visual Studio Code and there is no question that it is easier to install than Eclipse (which was always a bit of a nightmare imho with all the required Java installs it required). I also like how intuitive it is and that I can use it to do all sorts of other modern development. If there is a popular modern language out there, you can safely bet that VS Code supports it.

If you have not had a chance to check it out yet, I highly suggest you do so and just remember to keep an open mind.

Also, be aware that Salesforce Extensions for VS Code does not yet support everything that the Force.com IDE does. Like I said earlier, the original Force.com IDE is not going away, just the newer Beta version which included support for Salesforce DX and Lightning. It is going to take some time for the development team to get all the features that the Force.com IDE offers into Salesforce Extensions for VS Code.

But keep in mind, that VS Code is where they are headed, so if you have not yet checked out Visual Studio Code, now is the perfect time to do so. I think you will be pleasantly surprised and impressed with it.

And let me know what you think…

The Eclipse Force.com IDE makes an Epic Comeback – with support for Lightning!!!

I was so happy to see recently that Salesforce was refocusing it’s efforts towards improving the Eclipse Force.com IDE. It has also now gone open source. But I was MOST pleased to see that the beta version now offers support for Lightning components.

Developer Console is “ok”. Well, let’s be honest, as a serious development tool, it still sucks, although it is getting better with every release. There are also a plethora of other development tools that have popped up recently, but most of these are not free. Most developers I know use the freely available and very cool, MavensMate. Although, it’s creator Joe Ferrara has recently suspended development so he can focus on his newborn. Good choice by the way, Joe!!!.

But now, here comes Salesforce with something that not only includes Lightning support, but it also has some pretty nifty features that I think will make it a serious contender in the Salesforce IDE world. I really like the hover over documentation support that you see in the screenshot below. As well, as the outline pane over on the right, that allows you to quickly move back and forth between component bundle files.

ForceComIDE.png

But my absolute favorite thing is the auto completion, which is invaluable if you are just learning about Lightning. This missing feature almost made me not use Developer Console for my first Pluralsight course. But, I am so glad because not only can I use a free tool in my next course, I can use one that is fully supported by Salesforce themselves.

Way to go Salesforce! Much appreciated!!!

One big gotcha to keep in mind though is that you cannot run the Beta version of the IDE along with your prior version of the IDE (if you are indeed using it).


Who-hoo – The new Apex Interactive Debugger is finally here!!!

UPDATE on 3/1/2017: If you are interested in learning more about the Debugger, check out this Developers Relations Post. I would also suggest you check out this very interesting StackExchange Post, in which someone who has actually used the Debugger chimed in. FYI: It costs about $18,000/year.

Any Salesforce developer that has migrated from another language (especially .NET) knows that the debugging capabilities in Force.com are…ummm, how shall I put it?

They suck! Yeah, that’s it.

Well, guess what? As of Winter 16, Salesforce is offering a new Apex Interactive Debugger that will finally make developers of other platforms feel right at home.

I am talking about an interactive debugger that allows you to set, remove and suspend breakpoints. It also allows you to step in, step out, step over and through your code, as well as view variables at any point in the stack and also output System.debug statements to the console window.

This new interactive debugger is being offered as an eclipse plug-in (see image below).

ApexDebugger

Now, I must offer full disclosure right up front and tell you that there is one really big gotcha with this announcement and that is this:

It’s going to cost you. As in money. I would imagine a good amount of it too (although you will have to contact your Account Executive to find out exactly how much). Supposedly you can purchase debugger sessions that can be shared by your whole development team.

But why? Salesforce has always offered development tools for free.

The big reason for this cost is not because Salesforce is trying to make a lot of money off customers. It is to effectively limit the use of the tool. Because Salesforce is a multi-tenanted environment and resources are shared, if every customer all of a sudden was granted access to the new Apex Interactive Debugger, guess what would happen?

Crash!!!! as in all the servers lock up and no one is happy.

The Interactive debugger uses a debugger session manager and every debugging session is a transaction that can last up to 30 minutes. Each transaction needs a thread and a database connection. These are very expensive resources and in a shared environment, if every customer was able to do this, performance problems would quickly result.

Another thing to note is that the debugger uses the debugging API and at this time, that API is not publically available. This means that you will not find this kind of functionality offered in any third-party tools, such as MavensMate. Once Salesforce works out the kinks, they will likely release it publically, but in the meantime, the eclipse plug-in is the only way to go.

Also, for obvious reasons, this will only work on Sandbox orgs.

If you are a partner or a big development shop (now I am starting to wish I was one of those), then these limitations and the cost will likely not offset the benefit to having this super new tool. If you are interested in learning more, check out this Dreamforce video in which Josh Kaplan walks you through using the new debugger.

Happy debugging!!!!

UPDATE on 3/1/2017: If you are interested in learning more about the Debugger, check out this Developers Relations Post. I would also suggest you check out this very interesting StackExchange Post, in which someone who has actually used the Debugger chimed in. FYI: It costs about $18,000/year.

Lessons Learned While Writing Apex Code

I have been writing object-oriented code for several years and specifically writing Apex code for over a year now, yet every time I go to create a new class or a trigger, I feel like I learn something brand new. This post is a summary of some of the most important lessons I have learned. I hope it helps you to avoid some of the same speed bumps that I have encountered.

Tip #1 – Make sure you “Bulkify” every Trigger

This is “THE BIGGEST TIP”. It is probably the one you will see the most written about, but it is so critical to writing good code, that I think it is ok to re-stress the point. In case you do not know, bulkifying a trigger means that the trigger can effectively handle being executed numerous times (200 times typically). trigger

Why 200?

Well that is usually the maximum number of times it can be executed (depending on the context). You see, your trigger can be executed multiple ways. It can be executed by users performing actions in Salesforce, or it can be executed by someone bulk loading data through the Apex Data Loader or the API. If your code is not written efficiently, it could very well throw the dreaded “Too Many SOQL Queries”. Trust me, you do not want to see this message.

So how do you avoid it?

Glad you asked. I am not going to bore you with a long detailed explanation of what you can do to bulkify your triggers, because honestly that has been done to death. I will however, tell you the golden rule to remember when writing triggers:

“If any of the following statements (SELECT,UPDATE, INSERT,DELETE) appear within a for loop, your code needs work.”

Basically, if any of those statements (which represent either a SOQL Query or a DML statement) appears in a for loop, this means you are executing a very expensive operation numerous times (or at least as many times as the loop iterates, perhaps even more). Avoiding expensive database calls is a common thing to avoid in any programming language, but is especially important for Apex development because of Salesforce’s Governor Limits (which imho are GREAT for ensuring that we all create the best code possible).

If you want to learn more about all the things you can do to bulkify your triggers, check out this very informative post by Salesforce Guru, Jeff Douglas. Everyone should also checkout the post on the DeveloperForce Wiki titled, “Apex Code Best Practices“.

Tip #2 – Create at least two testMethods in your Unit Test Code

Most posts or instructions I read did not really stress the importance of creating both a single instance and bulk instance testMethod in your test class.

Why two methods and not just one?

The first method should be for testing what happens when a single record is handled. It is here that you should include System.AssertEquals to test whether a condition is true. This will tell you whether the trigger actually did what it was supposed to do.

It is possible to write Unit Test code that does not do this kind of check and still get 100% coverage. However, I would not consider the test to be a good one and neither should you.

The second test method should cover what happens when the trigger must handle multiple records. The following code is an example of using two such methods to test the validity of a trigger.

TestBulkCode

Tip #3 – Bulkifying your code is not just important for triggers

So what else is it important for?

How about Unit test code contained in class files – especially the ones that were built while keeping tip #2 in mind. That’s right, even your unit test code needs to be written efficiently – especially when it is set to execute a bulk testMethod.

If your Unit Test code uses a For loop to create a set of records and performs a SOQL query or a DML statement within that loop, guess what? Not only might you get an error, but your code is going to take way longer than it should to run tests and ultimately deploy.

This tip also applies to methods contained within a Helper class. The more efficient your code, the better, so always assume the worst and expect all of your code to be called multiple times.

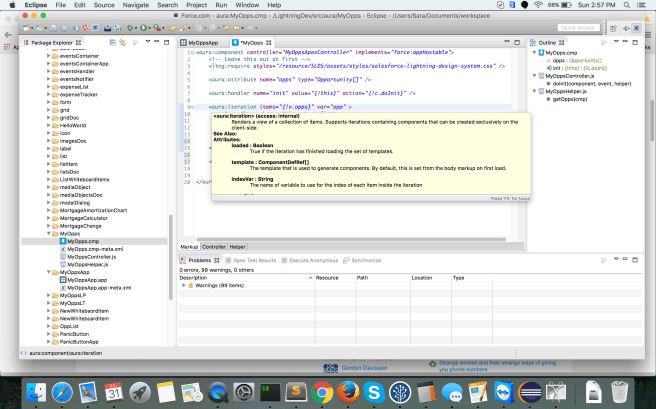
Tip #4 – Use Both the Developer Console AND the Force.com IDE

I have been very impressed with the newly available Developers Console. For a long time, the Force.com IDE was hands down the best tool for developing Apex code, but I feel like that is starting to shift – a bit, at least.

For some tasks, I prefer using the Force.com IDE – like for just browsing and editing code. I also love the schema editor for examining metadata. However, I am discovering that there are certain tasks that I prefer the Developer Console for.

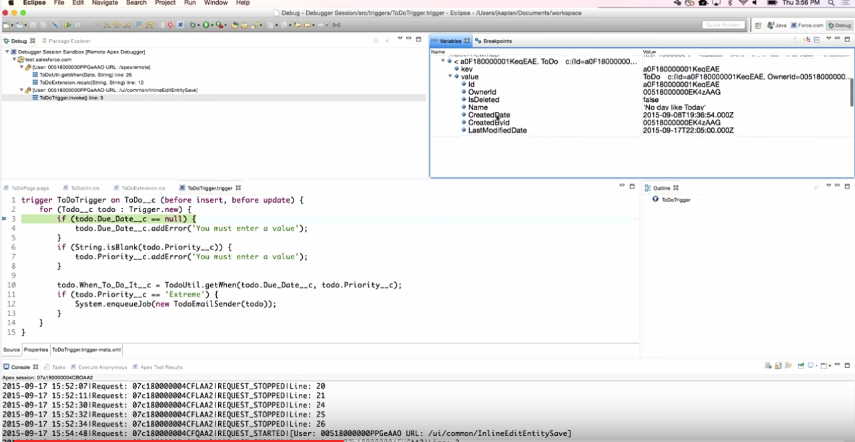
The biggest thing is for running Unit Tests. In my experience, the Developer Console is many times faster at executing unit tests – especially the ones that test bulk methods.

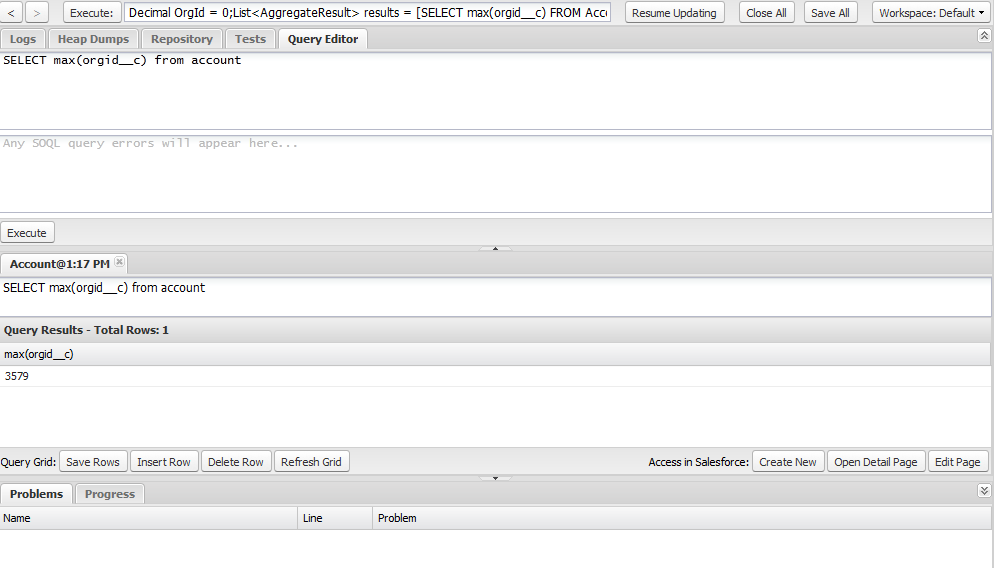
I also like the way the execute anonymous code area is right at the top of the Console. It just makes more sense to me in this spot. I also like the layout of the Query Editor tab and especially that it returns the value of an AggregateResult (see image below). This is something you cannot do with a query in the Schema Editor of the Force.com IDE

DeveloperConsole

If you have not checked out the Developer Console or only glanced at it, I encourage you to give it a look. Try doing some tasks in one tool and then switch to doing the same task in the other tool. You may be surprised by which you prefer.

Tip #5 – Periodically go back and evaluate old code

Just like no two people will likely write the same identical answer to an essay test, no two developers will write the same development code (unless of course, you copy someone else’s code). There are dozens, maybe hundreds of ways to code some things and most ways involve inefficient code. Chances are high that you have written at least one piece of code that can be improved.

Learning how to be an efficient developer is a process. You do not learn it by reading one article, one book, or one post. It takes time to develop the skills to write efficient code in every situation – especially when you are new to a platform or language. Set aside time (say once a year) to periodically go back and evaluate old code you have written. You will probably be surprised at how much you can learn in a year.