UPDATE on 3/1/2017: If you are interested in learning more about the Debugger, check out this Developers Relations Post. I would also suggest you check out this very interesting StackExchange Post, in which someone who has actually used the Debugger chimed in. FYI: It costs about $18,000/year.
Any Salesforce developer that has migrated from another language (especially .NET) knows that the debugging capabilities in Force.com are…ummm, how shall I put it?
They suck! Yeah, that’s it.
Well, guess what? As of Winter 16, Salesforce is offering a new Apex Interactive Debugger that will finally make developers of other platforms feel right at home.
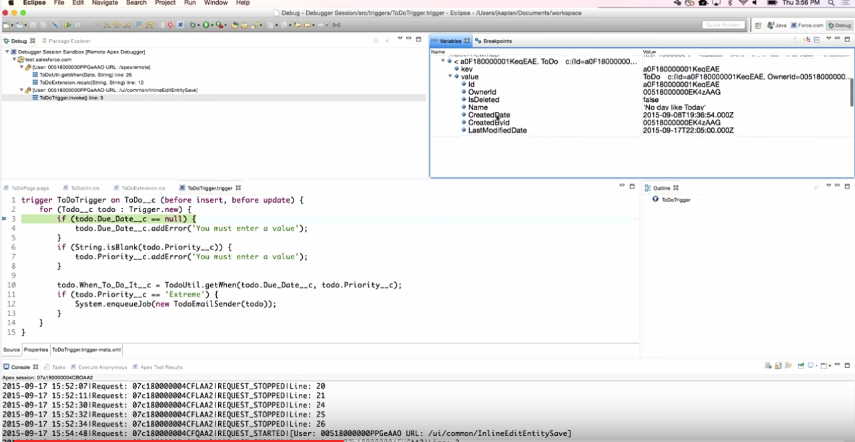
I am talking about an interactive debugger that allows you to set, remove and suspend breakpoints. It also allows you to step in, step out, step over and through your code, as well as view variables at any point in the stack and also output System.debug statements to the console window.
This new interactive debugger is being offered as an eclipse plug-in (see image below).
Now, I must offer full disclosure right up front and tell you that there is one really big gotcha with this announcement and that is this:
It’s going to cost you. As in money. I would imagine a good amount of it too (although you will have to contact your Account Executive to find out exactly how much). Supposedly you can purchase debugger sessions that can be shared by your whole development team.
But why? Salesforce has always offered development tools for free.
The big reason for this cost is not because Salesforce is trying to make a lot of money off customers. It is to effectively limit the use of the tool. Because Salesforce is a multi-tenanted environment and resources are shared, if every customer all of a sudden was granted access to the new Apex Interactive Debugger, guess what would happen?
Crash!!!! as in all the servers lock up and no one is happy.
The Interactive debugger uses a debugger session manager and every debugging session is a transaction that can last up to 30 minutes. Each transaction needs a thread and a database connection. These are very expensive resources and in a shared environment, if every customer was able to do this, performance problems would quickly result.
Another thing to note is that the debugger uses the debugging API and at this time, that API is not publically available. This means that you will not find this kind of functionality offered in any third-party tools, such as MavensMate. Once Salesforce works out the kinks, they will likely release it publically, but in the meantime, the eclipse plug-in is the only way to go.
Also, for obvious reasons, this will only work on Sandbox orgs.
If you are a partner or a big development shop (now I am starting to wish I was one of those), then these limitations and the cost will likely not offset the benefit to having this super new tool. If you are interested in learning more, check out this Dreamforce video in which Josh Kaplan walks you through using the new debugger.
Happy debugging!!!!
UPDATE on 3/1/2017: If you are interested in learning more about the Debugger, check out this Developers Relations Post. I would also suggest you check out this very interesting StackExchange Post, in which someone who has actually used the Debugger chimed in. FYI: It costs about $18,000/year.
